


A BOARING EQUILIBRIM
The current market structure is one of the longest periods where buy & sell pressures are in an Equilibrium; A product of the macroeconomic uncertainties and a persistent demand in $30K-$40K range.


On-chain Analysis
Supply/Demand
As a general rule of thumb, one of the main driving forces behind the cyclical nature of any financial market is the imbalances between Supply and Demand. Here, the intention to use the “Supply and Demand” terms is different from its classic definition, where the supply and demand relationship with the price is portrayed from the consumer's and producer’s point of view accordingly. In this article, supply and demand terms are equivalent to sell and buy pressure.
Many metrics can be employed as a proxy for demand vs supply in the Bitcoin market from an on-chain point of view (excluding the off-chain bitcoins held at Exchanges). The figure below represents the lower band of Mayer Multiple Band (0.6-MMB) 🟢 (0.6 * 200 DMA) as an indicator for demand, alongside the Realized Price (RP) 🟠 which is a probe into the supply distribution behaviour (realizing profit or loss on a macro-scale ?).
Comparing these two metrics’ trend, the following distinct patterns are noteworthy:
0.6-MMB crossing below RP: As shown by the red rectangles, this cross has always indicated a reversal momentum in the market.
0.6-MMB > RP & both rising sharply: These phases are where the demand pushes the price up while the supply distribution is strong in parallel with demand in the market, also known as the BULL MARKET (Green rectangle).
0.6-MMB > RP & both moving sideways: This pattern shows a rare condition where the supply and demand are in equilibrium. The dashed circles in the figure illustrate the mentioned pattern.
Currently, the market is witnessing one of the most extended periods of equilibrium. This formed balance between supply and demand in the $30K-$40K range started in May 2021 after reaching a new ATH at $64K.

Post Equilibrium Market Structure
The discussed equilibrium in the market can fail in any direction; Therefore, whether the market will start a bullish phase or face a capitulation has no particular answer. However, one can speculate based on the probability that what direction has a higher chance of occurring. Here, the 360 DMA of the “percentage of transfer volume in profit” is shown. This cyclical behaviour repeats its bearish phase, and the momentum has not demonstrated a reversal signal yet. Therefore, bearish price action is more likely to occur following the current equilibrium period.

Options Market
Options are a type of derivative Financial instrument that gives the buyer the right, but not the obligation, to buy or sell the underlying asset at a specified strike price & expiration date. Options give investors more flexible & complex strategies in order to speculate or hedge their portfolios.
40k strike supposed to be the key level during recent weeks while price hovered around it. Chart below which represents open interest by strike price for all expiration shows that lots of puts & calls bought/sold for 40k strike.
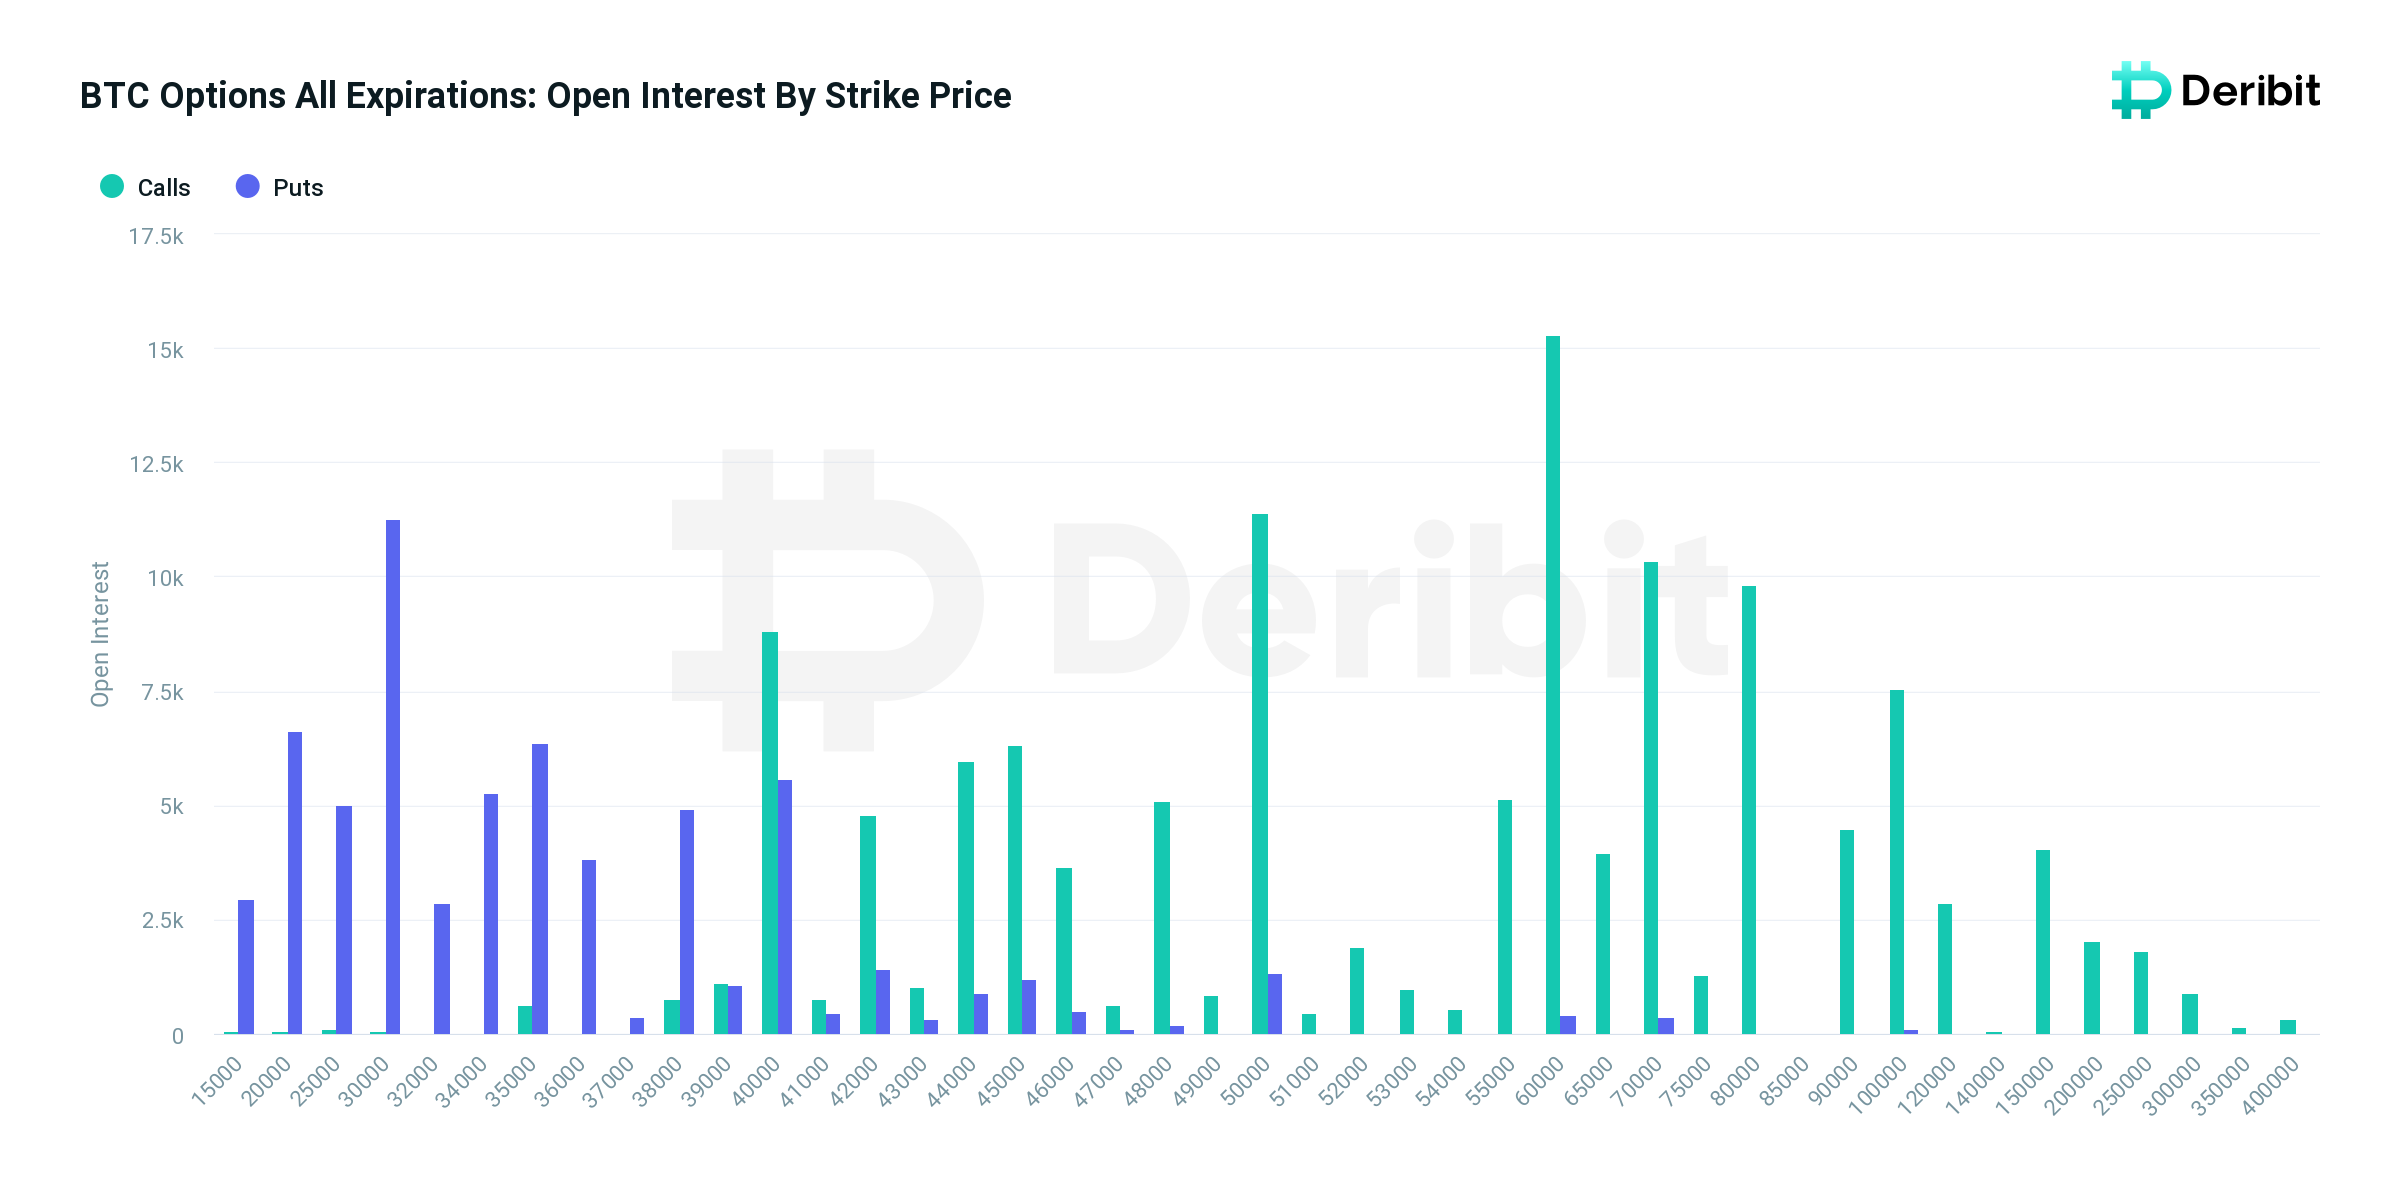
Global Markets and also crypto market are under pressure according to macroeconomics. Investors prefered to hedge against downside in the market. According to option flows buying puts for 29th APR 38k & 6th MAY 34k strike prices and also sold 38k/44k strangle for 27th MAY can be seen in options market.

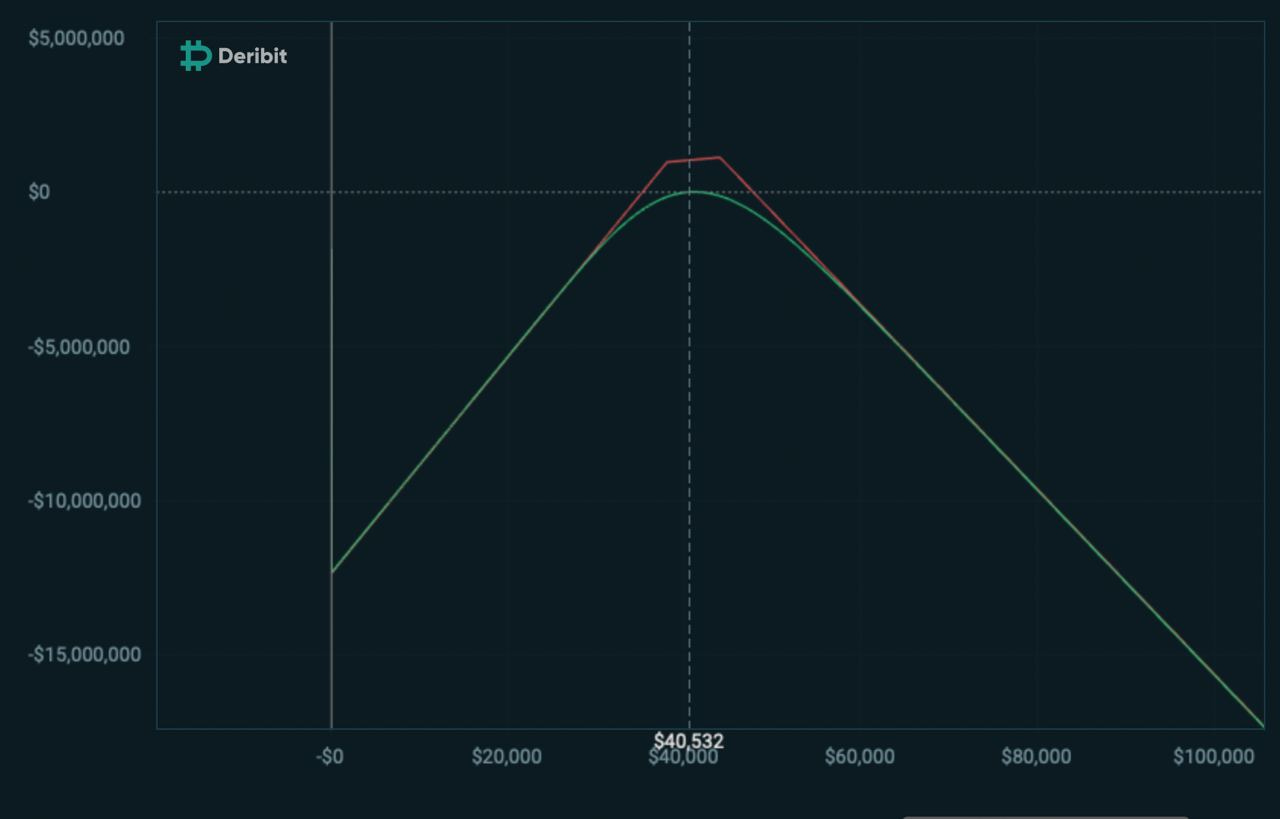
Short strangle strategy consists of one short call with a higher strike price and one short put with a lower strike price. The expiration date for both options is the same. This strategy profits when the price of the underlying asset trades in a narrow range between the breakeven points. Option traders might use this strategy to take advantage of a possible decrease in IV. Chart below shows simulation for sold 38k/44k strangle for 27MAY22.
Short_term ATM IV spiked and rose above 60 due to protection buyers and for now it is 59.6v but for longer_dated ATM IV, comparing to previous days, no significant change can be seen.
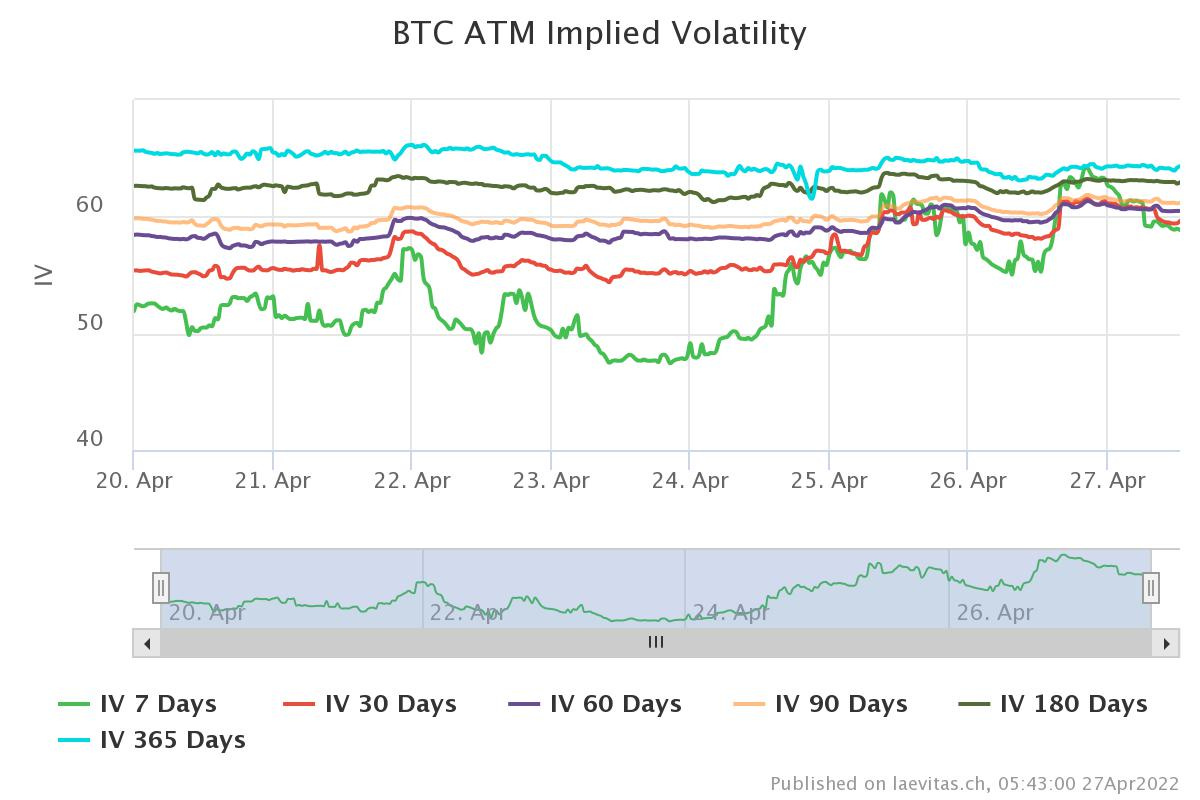
1 week BTC 25 d skew continue increasing shows position protection by investors.

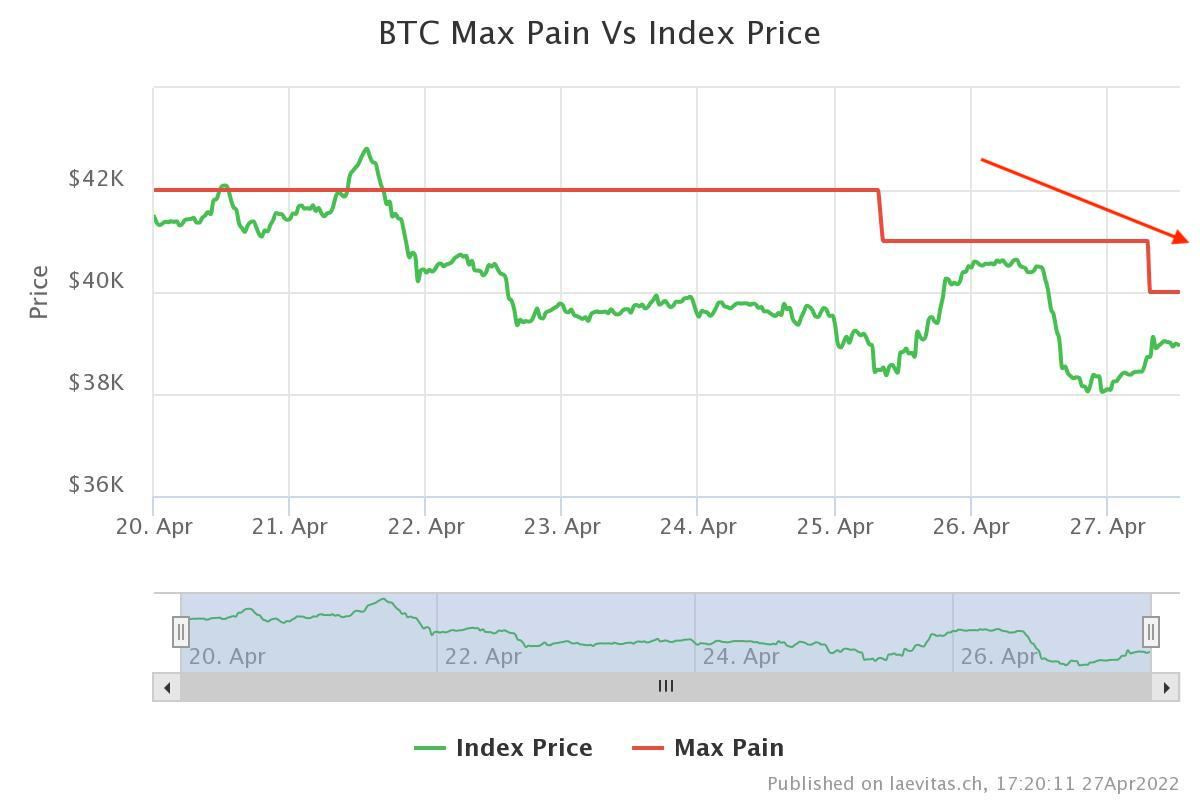
We can refer for a large expiry this Friday, Apr 29th,2022 that approximately $1.8B worth of BTC options contracts will expire on Deribit. P/C Ratio is 0.63 & max pain price is 40k. Max pain price ( the strike price that brings maximum loss to option buyers) decreased from 42k to 40k for this expiry which shows increasing negative sentiment in options market.
China's COVID-19 lockdowns, U.S. rate hikes, Ukraine/Russia crises, are all macroeconomic concerns that caused big players to stand away from crypto market. As mentioned above due to options datas investors & Block traders try to hedge risks which make the negative sentiment remains in the options market.
 | A guest post by
|
Sir, can I get this workbench ? Thanks alot