


HOW PAINFUL CAN A BEAR MARKET BE?
This report aims to investigate the last two Bitcoin Bear Markets from the onchain perspective.


What is a Bear Market?
"The definition of a bear market is when investors are more risk-averse than risk-seeking. This kind of bear market can last for months or years as investors shun speculation favouring boring, sure bets.
Bear markets can be cyclical or longer-term. The former lasts for several weeks or a couple of months and the latter can last for several years" _ Investopedia.
The definition of a Bear Market has been the subject of many debates. This newsletter reviews the market participants' behaviour throughout the previous two prolonged price depreciation periods in the Bitcoin market.
In this article, to specify a common ground, periods that price was lower than 200 DMA for more than a month are considered a bearish phase.

In a former tweet (IS 30K THE BEAR MARKET'S FLOOR?), the resemblance of the $30K level and the $6.4K floor price in 2018, as well as the possible outcomes of a Black Swan event, were discussed briefly. To wrap up this discussion, the structure of the 2014-2015 and 2018-2019 bear markets are examined further.
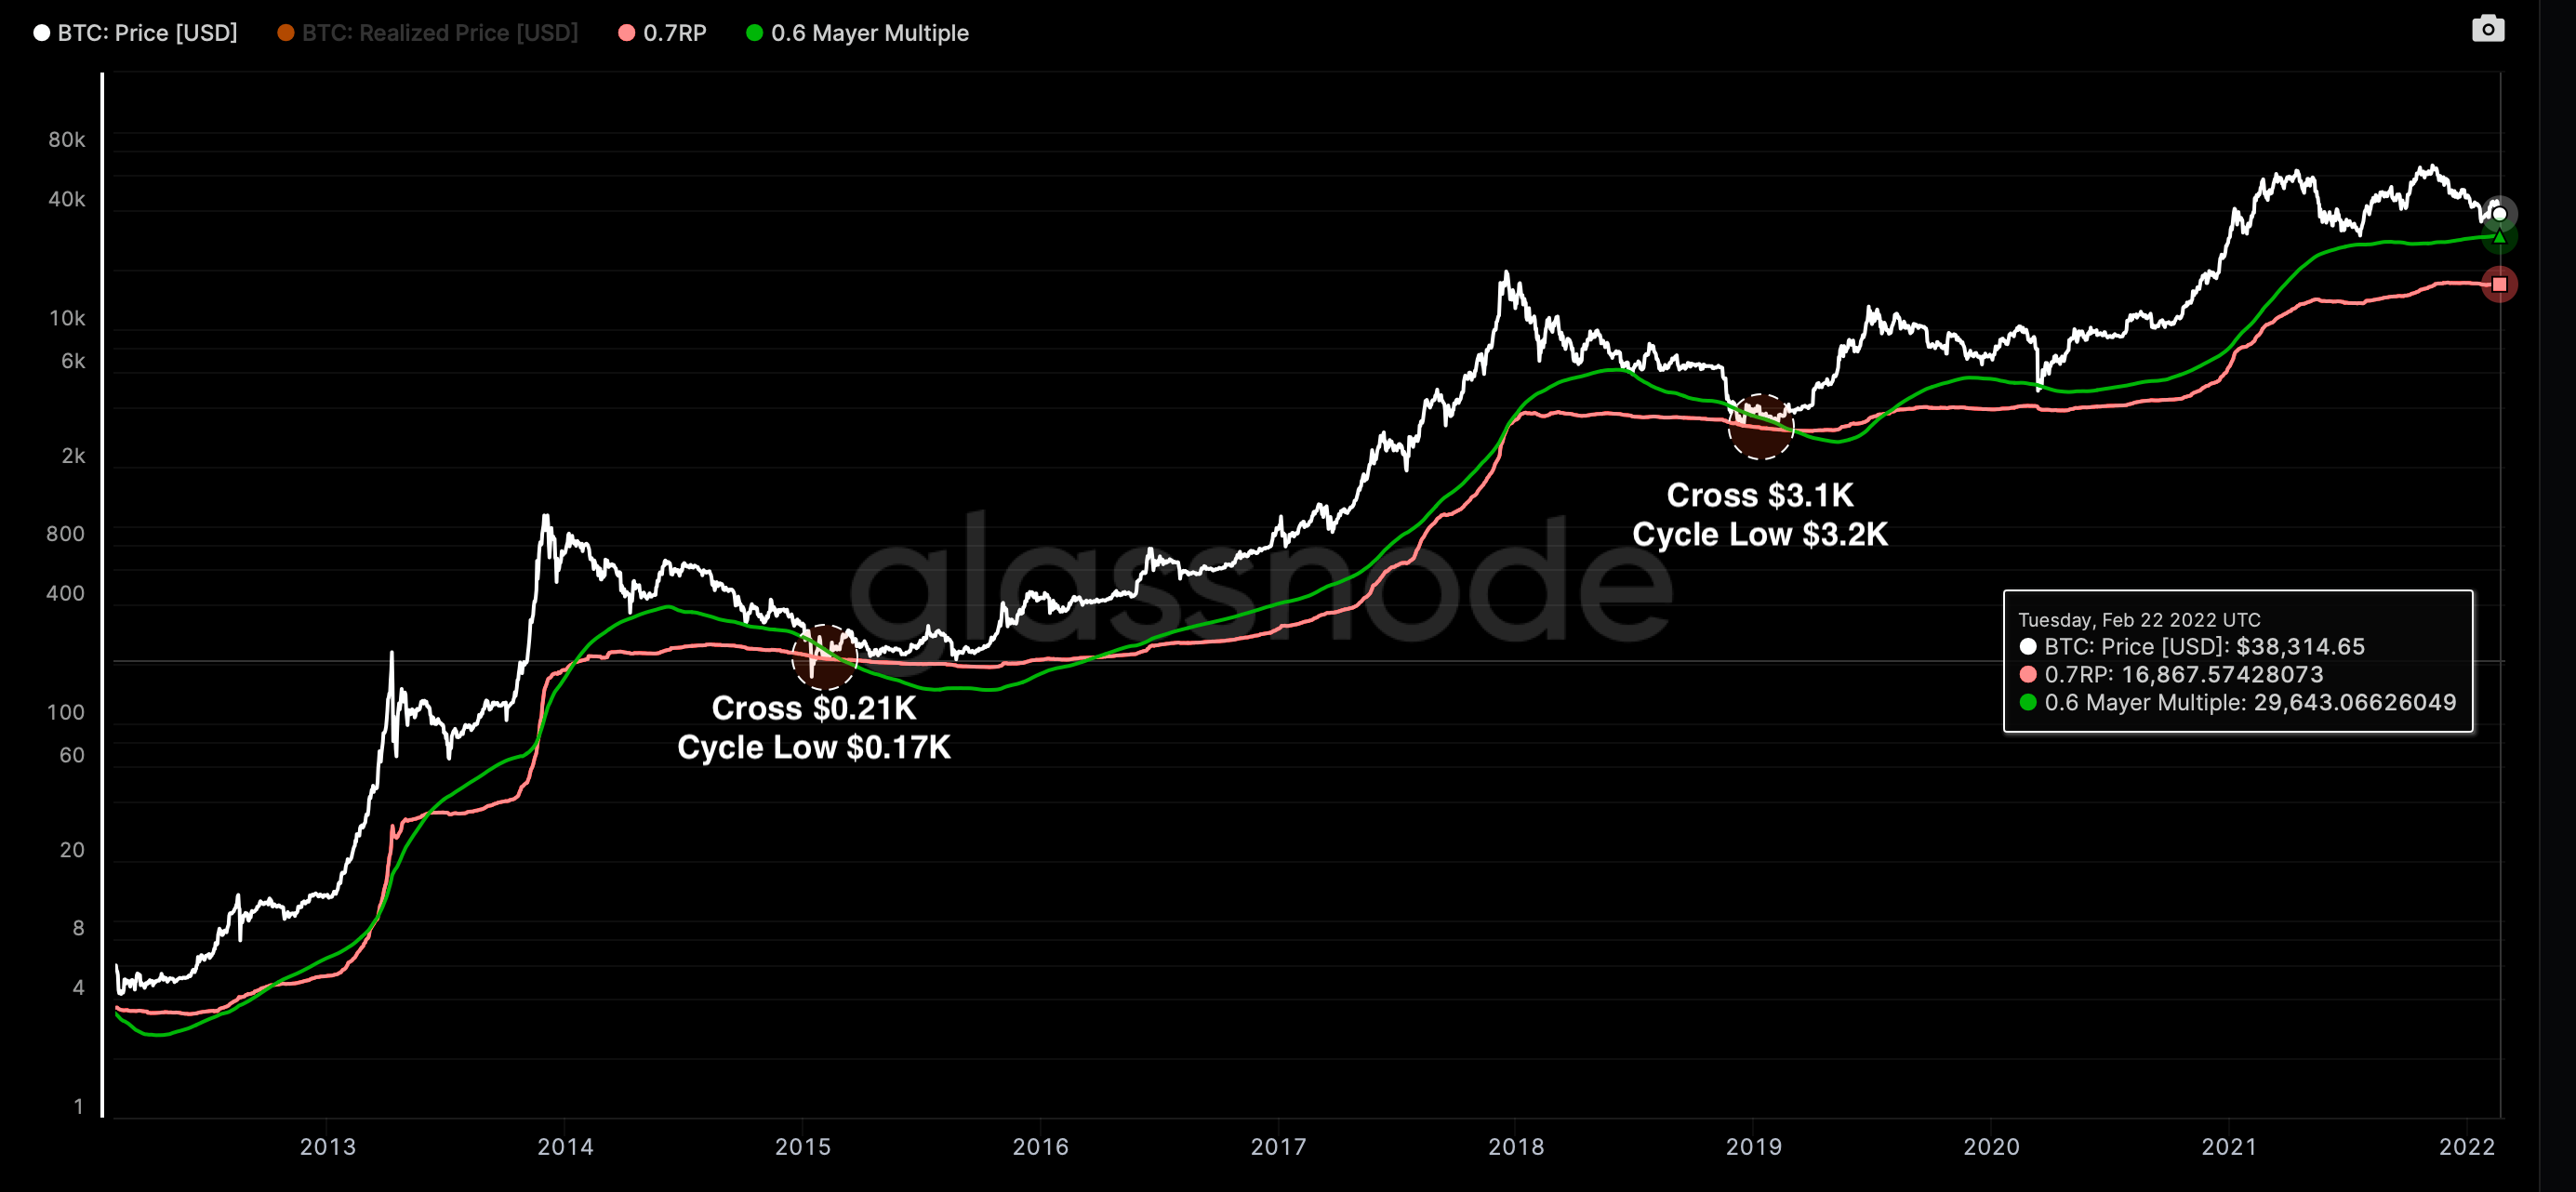
Bottom Price Models
Many onchain and technical price models attempt to capture the cycl’ bottom price. Two of Speculators' well-known benchmarks to track cycle bottoms are the Mayer Multiple (0.6X) and Realized Price Multiple (0.7X). Figure 2 displays the historical performance of these two models in estimating the global bottoms for the last two bear markets. Considering the current value of these multipliers, the $17K is an equivalent outcome to anticipate in a possible nightmare scenario. Nevertheless, the fast-growing effect of Derivative Markets (high liquidity) on price discovery mechanisms should be considered. Therefore, through a significant disturbance in the market, the expected price action can be remarkably different.
Realized Loss Band Breakdown
Investors tend to get exhausted during a bear market and realize more losses under psychological pressure. The typical onchain metric to study loss realization magnitude is SOPR and Total Realized Loss Volume. Figure 02 demonstrates the Relative Realized Loss Bands normalized by market cap. As presented in the chart, the total realized loss magnitude increased from 0.05% at the beginning of the bear market to >0.25% (of market cap) acycle'srice plunged to the global cycle’s bottom.

The following figure shows the band that realized a 20%-50% loss. These phases continued for approximately +10 months from cycle'sst post-ATH crash till the cycle’s bottom. However, during this cycle (post-halving in 2020), the market had its first major crash in May-July 2021. Since then, the 20%-50% realized loss band has persisted for ~7 months so far. Meanwhile, the occurrence of a new ATH during this period could be a sign of distancing from the 4-year cyclical structure in the bitcoin market.
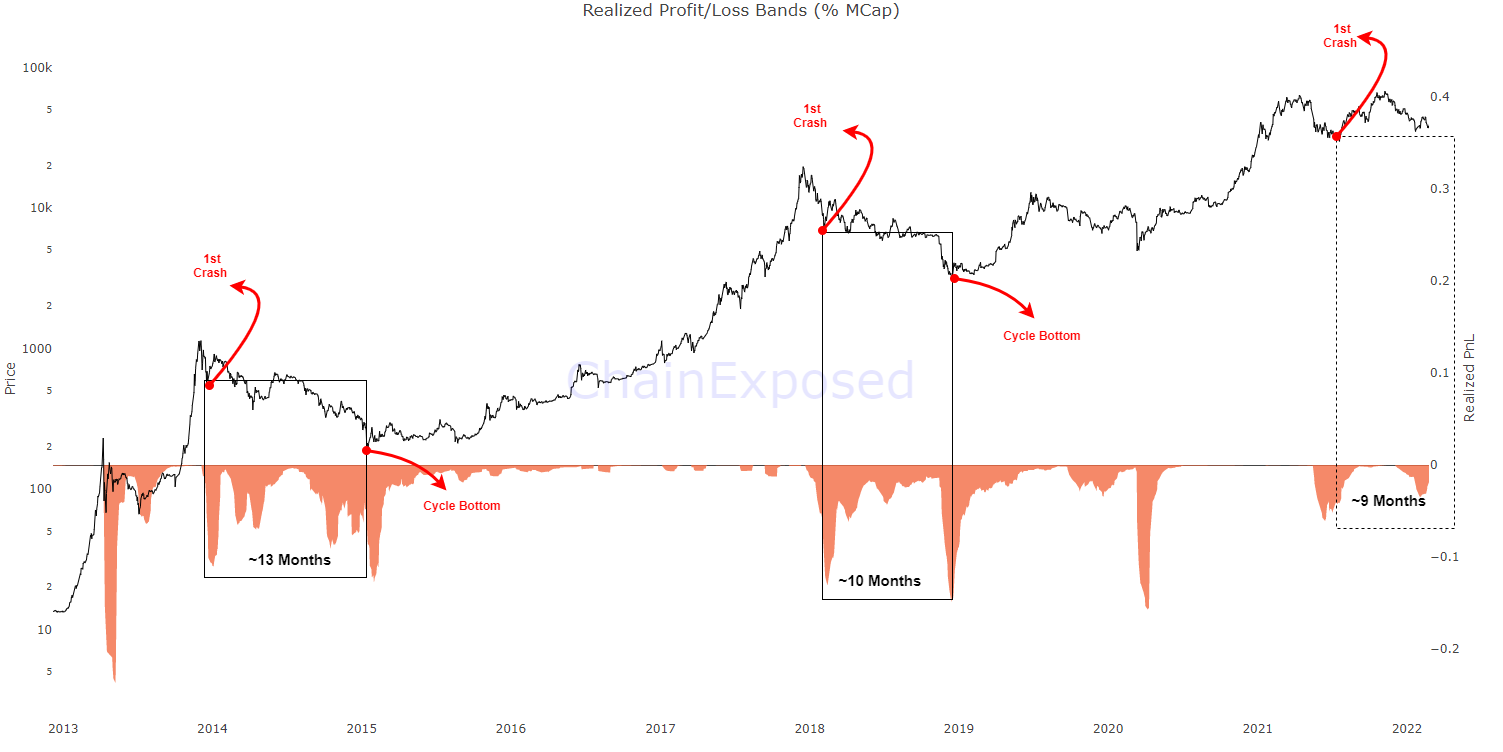
The higher band of realized loss (50%-80% loss) has not occurred in this cycle, simply because the price has not plunged more than ~50% from its ATH yet.
Market Exhaustion and HODLING Conviction
Among all bear market indicators, the Percent of UTXO in Profit is a simple but informative metric that can gauge the unrealized profit and loss in the market. The interesting aspect to highlight in this chart is how fast this metric is declining in a bear market. Historically, this metric dropped ~ 4.3%-4.5% per month in the last two cycles. On the contrary, this metric has diminished ~2.2% per month in the current cycle. This observation confirms that HODLing conviction has been much more robust in 2021-2022.
